Commercial Plots for Sale in Mumtaz City Islamabad
Comprehensive guide to commercial plots in Mumtaz City Islamabad. Featuring 150-Foot Main Boulevard commercial plots and Sector Commercial plots (4 Marla, 5 Marla, 8 Marla) with RDA high-rise zoning, massive frontage, and high commercial rental yields.
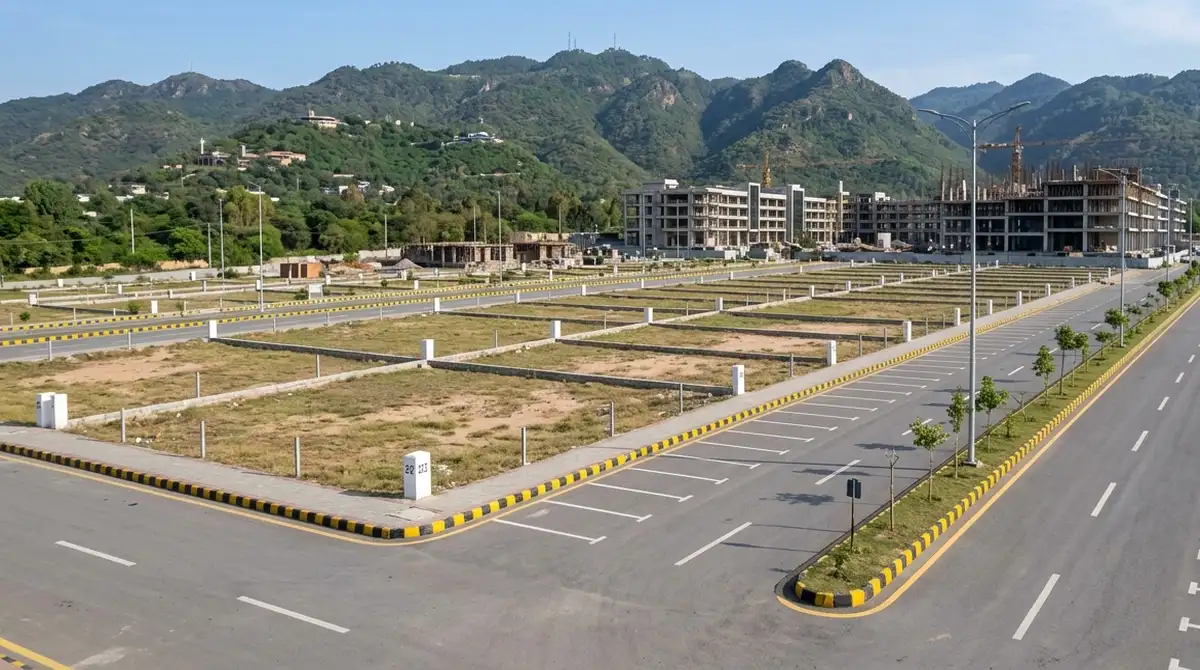
1. Strategic Master Commercial Zoning in Mumtaz City
150-Foot Main Boulevard Commercial Spine
Designed for flagship commercial projects, multi-tenant shopping malls, executive business hotels, and regional corporate offices. Featuring wide dedicated service roads and extensive customer parking bays.
Sector Commercial & Convenience Markets
Embedded within residential blocks (Executive, Chenab, Indus) to cater to daily domestic needs, accommodating grocery supermarkets, pharmacies, bakeries, and neighborhood clinics.
2. Commercial Plot Sizes & Building Bylaws
4 Marla Commercial (30×30 / 100 Sq. Yds)
Standard sector commercial plot with permissible height of Basement + Ground + 4 Floors. Ideal for standalone retail plazas, diagnostic clinics, or bank branches.
5 Marla Commercial (30×37.5 / 125 Sq. Yds)
High-visibility retail plots located along sector connector roads, delivering high foot traffic and strong rental yields.
8 Marla Commercial (40×45 / 200 Sq. Yds)
Flagship retail footprint for multi-story branded outlets, departmental stores, and corporate regional headquarters.
Main Boulevard Commercial Land (10 Marla to 2 Kanal)
Zoned for multi-storey high-rise commercial complexes (Basement + Ground + 7 to 9 Floors) subject to CAA flight funnel height approvals.
3. 2026 Commercial Price Benchmarks & Valuation Matrix
4 Marla Sector Commercial
PKR 2.0 Crore – 3.5 Crore depending on corner location and block habitation.
5 Marla Commercial Plot
PKR 2.8 Crore – 4.8 Crore across major sector commercial avenues.
8 Marla Commercial Plot
PKR 5.0 Crore – 8.5 Crore on prime commercial thoroughfares.
Main Boulevard Commercial Plots
PKR 7.5 Crore to PKR 20+ Crore for signature mega-commercial plots.
4. Commercial Rental Yields & Business Opportunities
Expected Rental Yields
Commercial rental yields in Mumtaz City average 7.5% to 9.2% per annum, outperforming residential yields due to constant tenant demand from retail brands, airline service offices, and logistics firms.
Amlaaq Commercial Due Diligence
We verify commercial plot demarcations, FAR guidelines, parking clearances, and official NDC records at the MCC Head Office.
5. Prominent Commercial Projects & Brand Footprint
Premier retail mall featuring branded supermarkets, international dining, corporate executive office suites, and rooftop terrace lounge.
Modern architectural facade with high-speed glass lifts, central atrium, dedicated basement parking, and high rental return serviced suites.
High footfall commercial arcade anchored by grocery marts, bakeries, pharmacies, and specialty food outlets serving over 500+ resident families.
Houses regional offices of engineering firms, real estate corporate headquarters, aviation logistic offices, and executive healthcare clinics.
AMLAAQ.PK
Premier Property Advisory & Real Estate Marketing Portal • Rawalpindi & Islamabad
Portal: https://amlaaq.pk
Target Project: Faisal Town Phase 2 (Zedem International)
Mumtaz City 5-Step Title Verification Protocol
Protecting your investment against unverified files, unauthorized dealer receipts, and hidden surcharges. Follow this forensic title checklist before executing any transaction in Mumtaz City Islamabad.
MCC Official Allotment & Transfer Deed Audit
- Inspect the original security allotment certificate issued by Mumtaz Construction Company (MCC) featuring specialized watermark, embossed seal, and unique serial barcode.
- Cross-verify the official membership number, sector block (Executive, Chenab, Indus, Ravi), plot number, and dimensions in square yards.
- Ensure zero unauthorized dealer endorsements, manual overwriting, or correction fluid marks exist on the primary title allotment deed.
Head Office Central Record & RDA NOC Audit
- Visit the Mumtaz City Head Office for real-time CRM database verification with the legal transfer directorate.
- Confirm that the plot is 100% sanctioned under RDA NOC reference RDA/MP&TE/F-PHS-18/250 with clear non-encumbrance status.
- Check that the plot number accurately corresponds to the approved RDA Layout Plan (LOP) without overlapping boundary lines or green belt encroachment.
Statement of Account (SOA) & No Demand Certificate (NDC)
- Audit all historical bank deposit slips against official MCC designated bank collection accounts.
- Verify total principal and development charges paid to date against the certified Statement of Account (SOA) issued by the finance wing.
- Obtain an official No Demand Certificate (NDC) certifying zero pending development surcharges, possession charges, or utility arrears.
FBR Section 236C, 236K & Stamp Duty Compliance
- Verify Active Taxpayer List (ATL) status for both Seller (Transferor) and Buyer (Transferee) on the FBR IRIS portal.
- Ensure generation and payment of FBR Section 236K advance tax for buyer and Section 236C for seller with official Computerized Payment Receipts (CPR).
- Attach verified provincial stamp duty challans and official MCC transfer fee payment receipts to the formal transfer docket.
On-Ground Spatial Demarcation & Site Inspection
- Conduct an on-site physical inspection with Mumtaz City site survey engineers to verify boundary pillars, road leveling, and plot coordinates.
- Confirm the plot is not positioned on a deep natural depression, drainage nullah, excessive slope, or high-tension power line corridor.
- For ready-possession sectors (Executive, Chenab, Indus), request the official possession handover letter and on-ground demarcation certificate for immediate building permission.
Mumtaz City Price & FBR Tax Simulator
Select any plot, commercial unit, apartment, or villa to estimate secondary market price, FBR Advance Tax (Section 236K Filer vs Non-Filer), MCC official transfer fees, and net acquisition cost.
5 Marla Residential Plot
6. GT Road Commercial Premium & N-5 Highway Frontage
N-5 Highway Frontage Retail Demand
Commercial plots with direct or secondary frontage towards the GT Road arterial links command a 30% to 45% premium over internal sector commercials. This is driven by high-volume transit traffic, logistics companies, and wholesale retail brands seeking maximum visibility without entering the congested city centers of Rawalpindi.
CPEC Route Connectivity
With the expansion of the M-1/M-2 motorways and CPEC-related infrastructure, Mumtaz City’s commercial zones are increasingly targeted by multinational corporations for regional headquarters and transit warehousing.
7. Commercial Capital Appreciation Matrix (2020-2026)
| Plot Category | Avg. Price 2020 | Avg. Price 2026 | Total Appreciation |
|---|---|---|---|
| 4 Marla Sector Commercial | PKR 75 Lac | PKR 2.75 Crore | +266% |
| 8 Marla Main Boulevard | PKR 1.80 Crore | PKR 6.50 Crore | +261% |
| 1 Kanal High-Rise Plot | PKR 4.50 Crore | PKR 14.0+ Crore | +211% |
8. Urban Development & Infrastructure Readiness
9. Comprehensive Investment Security & Legal Safeguards
When acquiring commercial real estate in Mumtaz City, establishing an impregnable legal footprint is just as critical as selecting the right location. Amlaaq provides an end-to-end legal verification framework designed to eliminate friction, prevent title disputes, and ensure a seamless handover of commercial assets.
- ✓ Biometric Verification: Mandatory biometric endorsement through NADRA integration at the developer's head office ensures both buyer and seller are physically present, eliminating power-of-attorney fraud.
- ✓ No Demand Certificate (NDC): A rigorous multi-departmental audit is conducted before any transfer, ensuring all utility arrears, development charges, and society maintenance fees are cleared in full.
- ✓ FBR Tax Compliance: Strict adherence to Section 236C (for sellers) and 236K (for buyers) ensures all transactions are logged in the Federal Board of Revenue’s active taxpayer directory, securing the investment's white-wealth status.
- ✓ RDA Map Sanctioning: Prior to any commercial construction, architectural blueprints undergo strict scrutiny by the Rawalpindi Development Authority to ensure structural integrity and compliance with zoning bylaws.
- ✓ CAA Height Clearances: Because of the proximity to the Islamabad Airport flight funnel, all high-rise commercial structures require specific No Objection Certificates (NOC) from the Civil Aviation Authority.
This robust governance structure not only protects your initial capital but also accelerates future resale liquidity, as incoming buyers and institutional investors strongly prefer assets with a transparent, digitized, and legally unassailable chain of ownership.
Frequently Asked Questions: Commercial Plots in Mumtaz City
Does the GT Road proximity affect commercial plot values? +
What are the future prospects for commercial investments here? +
Are there specific zones for corporate vs retail buildings? +
What commercial plot sizes are available in Mumtaz City? +
What is the permissible height for commercial buildings? +
What is the price of a 4 Marla commercial plot? +
Are commercial plots approved by RDA? +
Book Inspection & Verify File in Mumtaz City
Direct consultation with verified Amlaaq real estate advisors. We handle official MCC record checks, NDC verification, FBR withholding taxes, and on-ground demarcation.
GT Road N-5 commercial corridor analysis (120,000 daily vehicles), zoning comparison with MPCHS commercial plots, why GT Road commercial is more liquid than interior schemes.
GT Road N-5 commercial corridor analysis (120,000 daily vehicles), zoning comparison with MPCHS commercial plots, why GT Road commercial is more liquid than interior schemes.
GT Road N-5 commercial corridor analysis (120,000 daily vehicles), zoning comparison with MPCHS commercial plots, why GT Road commercial is more liquid than interior schemes.
GT Road N-5 commercial corridor analysis (120,000 daily vehicles), zoning comparison with MPCHS commercial plots, why GT Road commercial is more liquid than interior schemes.
GT Road N-5 commercial corridor analysis (120,000 daily vehicles), zoning comparison with MPCHS commercial plots, why GT Road commercial is more liquid than interior schemes.
GT Road N-5 commercial corridor analysis (120,000 daily vehicles), zoning comparison with MPCHS commercial plots, why GT Road commercial is more liquid than interior schemes.
GT Road N-5 commercial corridor analysis (120,000 daily vehicles), zoning comparison with MPCHS commercial plots, why GT Road commercial is more liquid than interior schemes.
GT Road N-5 commercial corridor analysis (120,000 daily vehicles), zoning comparison with MPCHS commercial plots, why GT Road commercial is more liquid than interior schemes.
GT Road N-5 commercial corridor analysis (120,000 daily vehicles), zoning comparison with MPCHS commercial plots, why GT Road commercial is more liquid than interior schemes.
GT Road N-5 commercial corridor analysis (120,000 daily vehicles), zoning comparison with MPCHS commercial plots, why GT Road commercial is more liquid than interior schemes.
GT Road N-5 commercial corridor analysis (120,000 daily vehicles), zoning comparison with MPCHS commercial plots, why GT Road commercial is more liquid than interior schemes.
GT Road N-5 commercial corridor analysis (120,000 daily vehicles), zoning comparison with MPCHS commercial plots, why GT Road commercial is more liquid than interior schemes.
GT Road N-5 commercial corridor analysis (120,000 daily vehicles), zoning comparison with MPCHS commercial plots, why GT Road commercial is more liquid than interior schemes.
GT Road N-5 commercial corridor analysis (120,000 daily vehicles), zoning comparison with MPCHS commercial plots, why GT Road commercial is more liquid than interior schemes.
GT Road N-5 commercial corridor analysis (120,000 daily vehicles), zoning comparison with MPCHS commercial plots, why GT Road commercial is more liquid than interior schemes.
GT Road N-5 commercial corridor analysis (120,000 daily vehicles), zoning comparison with MPCHS commercial plots, why GT Road commercial is more liquid than interior schemes.
GT Road N-5 commercial corridor analysis (120,000 daily vehicles), zoning comparison with MPCHS commercial plots, why GT Road commercial is more liquid than interior schemes.
GT Road N-5 commercial corridor analysis (120,000 daily vehicles), zoning comparison with MPCHS commercial plots, why GT Road commercial is more liquid than interior schemes.
GT Road N-5 commercial corridor analysis (120,000 daily vehicles), zoning comparison with MPCHS commercial plots, why GT Road commercial is more liquid than interior schemes.
GT Road N-5 commercial corridor analysis (120,000 daily vehicles), zoning comparison with MPCHS commercial plots, why GT Road commercial is more liquid than interior schemes.
GT Road N-5 commercial corridor analysis (120,000 daily vehicles), zoning comparison with MPCHS commercial plots, why GT Road commercial is more liquid than interior schemes.
GT Road N-5 commercial corridor analysis (120,000 daily vehicles), zoning comparison with MPCHS commercial plots, why GT Road commercial is more liquid than interior schemes.
GT Road N-5 commercial corridor analysis (120,000 daily vehicles), zoning comparison with MPCHS commercial plots, why GT Road commercial is more liquid than interior schemes.
GT Road N-5 commercial corridor analysis (120,000 daily vehicles), zoning comparison with MPCHS commercial plots, why GT Road commercial is more liquid than interior schemes.
GT Road N-5 commercial corridor analysis (120,000 daily vehicles), zoning comparison with MPCHS commercial plots, why GT Road commercial is more liquid than interior schemes.
GT Road N-5 commercial corridor analysis (120,000 daily vehicles), zoning comparison with MPCHS commercial plots, why GT Road commercial is more liquid than interior schemes.
GT Road N-5 commercial corridor analysis (120,000 daily vehicles), zoning comparison with MPCHS commercial plots, why GT Road commercial is more liquid than interior schemes.
GT Road N-5 commercial corridor analysis (120,000 daily vehicles), zoning comparison with MPCHS commercial plots, why GT Road commercial is more liquid than interior schemes.
GT Road N-5 commercial corridor analysis (120,000 daily vehicles), zoning comparison with MPCHS commercial plots, why GT Road commercial is more liquid than interior schemes.
GT Road N-5 commercial corridor analysis (120,000 daily vehicles), zoning comparison with MPCHS commercial plots, why GT Road commercial is more liquid than interior schemes.
GT Road N-5 commercial corridor analysis (120,000 daily vehicles), zoning comparison with MPCHS commercial plots, why GT Road commercial is more liquid than interior schemes.
GT Road N-5 commercial corridor analysis (120,000 daily vehicles), zoning comparison with MPCHS commercial plots, why GT Road commercial is more liquid than interior schemes.
GT Road N-5 commercial corridor analysis (120,000 daily vehicles), zoning comparison with MPCHS commercial plots, why GT Road commercial is more liquid than interior schemes.
GT Road N-5 commercial corridor analysis (120,000 daily vehicles), zoning comparison with MPCHS commercial plots, why GT Road commercial is more liquid than interior schemes.
GT Road N-5 commercial corridor analysis (120,000 daily vehicles), zoning comparison with MPCHS commercial plots, why GT Road commercial is more liquid than interior schemes.
GT Road N-5 commercial corridor analysis (120,000 daily vehicles), zoning comparison with MPCHS commercial plots, why GT Road commercial is more liquid than interior schemes.
GT Road N-5 commercial corridor analysis (120,000 daily vehicles), zoning comparison with MPCHS commercial plots, why GT Road commercial is more liquid than interior schemes.
GT Road N-5 commercial corridor analysis (120,000 daily vehicles), zoning comparison with MPCHS commercial plots, why GT Road commercial is more liquid than interior schemes.
GT Road N-5 commercial corridor analysis (120,000 daily vehicles), zoning comparison with MPCHS commercial plots, why GT Road commercial is more liquid than interior schemes.
GT Road N-5 commercial corridor analysis (120,000 daily vehicles), zoning comparison with MPCHS commercial plots, why GT Road commercial is more liquid than interior schemes.
GT Road N-5 commercial corridor analysis (120,000 daily vehicles), zoning comparison with MPCHS commercial plots, why GT Road commercial is more liquid than interior schemes.
GT Road N-5 commercial corridor analysis (120,000 daily vehicles), zoning comparison with MPCHS commercial plots, why GT Road commercial is more liquid than interior schemes.
GT Road N-5 commercial corridor analysis (120,000 daily vehicles), zoning comparison with MPCHS commercial plots, why GT Road commercial is more liquid than interior schemes.
GT Road N-5 commercial corridor analysis (120,000 daily vehicles), zoning comparison with MPCHS commercial plots, why GT Road commercial is more liquid than interior schemes.
GT Road N-5 commercial corridor analysis (120,000 daily vehicles), zoning comparison with MPCHS commercial plots, why GT Road commercial is more liquid than interior schemes.
GT Road N-5 commercial corridor analysis (120,000 daily vehicles), zoning comparison with MPCHS commercial plots, why GT Road commercial is more liquid than interior schemes.
GT Road N-5 commercial corridor analysis (120,000 daily vehicles), zoning comparison with MPCHS commercial plots, why GT Road commercial is more liquid than interior schemes.
GT Road N-5 commercial corridor analysis (120,000 daily vehicles), zoning comparison with MPCHS commercial plots, why GT Road commercial is more liquid than interior schemes.
GT Road N-5 commercial corridor analysis (120,000 daily vehicles), zoning comparison with MPCHS commercial plots, why GT Road commercial is more liquid than interior schemes.
GT Road N-5 commercial corridor analysis (120,000 daily vehicles), zoning comparison with MPCHS commercial plots, why GT Road commercial is more liquid than interior schemes.
GT Road N-5 commercial corridor analysis (120,000 daily vehicles), zoning comparison with MPCHS commercial plots, why GT Road commercial is more liquid than interior schemes.
GT Road N-5 commercial corridor analysis (120,000 daily vehicles), zoning comparison with MPCHS commercial plots, why GT Road commercial is more liquid than interior schemes.
GT Road N-5 commercial corridor analysis (120,000 daily vehicles), zoning comparison with MPCHS commercial plots, why GT Road commercial is more liquid than interior schemes.
GT Road N-5 commercial corridor analysis (120,000 daily vehicles), zoning comparison with MPCHS commercial plots, why GT Road commercial is more liquid than interior schemes.
GT Road N-5 commercial corridor analysis (120,000 daily vehicles), zoning comparison with MPCHS commercial plots, why GT Road commercial is more liquid than interior schemes.
GT Road N-5 commercial corridor analysis (120,000 daily vehicles), zoning comparison with MPCHS commercial plots, why GT Road commercial is more liquid than interior schemes.
GT Road N-5 commercial corridor analysis (120,000 daily vehicles), zoning comparison with MPCHS commercial plots, why GT Road commercial is more liquid than interior schemes.
GT Road N-5 commercial corridor analysis (120,000 daily vehicles), zoning comparison with MPCHS commercial plots, why GT Road commercial is more liquid than interior schemes.
GT Road N-5 commercial corridor analysis (120,000 daily vehicles), zoning comparison with MPCHS commercial plots, why GT Road commercial is more liquid than interior schemes.
GT Road N-5 commercial corridor analysis (120,000 daily vehicles), zoning comparison with MPCHS commercial plots, why GT Road commercial is more liquid than interior schemes.
GT Road N-5 commercial corridor analysis (120,000 daily vehicles), zoning comparison with MPCHS commercial plots, why GT Road commercial is more liquid than interior schemes.
GT Road N-5 commercial corridor analysis (120,000 daily vehicles), zoning comparison with MPCHS commercial plots, why GT Road commercial is more liquid than interior schemes.
GT Road N-5 commercial corridor analysis (120,000 daily vehicles), zoning comparison with MPCHS commercial plots, why GT Road commercial is more liquid than interior schemes.
GT Road N-5 commercial corridor analysis (120,000 daily vehicles), zoning comparison with MPCHS commercial plots, why GT Road commercial is more liquid than interior schemes.
GT Road N-5 commercial corridor analysis (120,000 daily vehicles), zoning comparison with MPCHS commercial plots, why GT Road commercial is more liquid than interior schemes.
GT Road N-5 commercial corridor analysis (120,000 daily vehicles), zoning comparison with MPCHS commercial plots, why GT Road commercial is more liquid than interior schemes.
GT Road N-5 commercial corridor analysis (120,000 daily vehicles), zoning comparison with MPCHS commercial plots, why GT Road commercial is more liquid than interior schemes.
GT Road N-5 commercial corridor analysis (120,000 daily vehicles), zoning comparison with MPCHS commercial plots, why GT Road commercial is more liquid than interior schemes.
GT Road N-5 commercial corridor analysis (120,000 daily vehicles), zoning comparison with MPCHS commercial plots, why GT Road commercial is more liquid than interior schemes.
GT Road N-5 commercial corridor analysis (120,000 daily vehicles), zoning comparison with MPCHS commercial plots, why GT Road commercial is more liquid than interior schemes.
GT Road N-5 commercial corridor analysis (120,000 daily vehicles), zoning comparison with MPCHS commercial plots, why GT Road commercial is more liquid than interior schemes.
GT Road N-5 commercial corridor analysis (120,000 daily vehicles), zoning comparison with MPCHS commercial plots, why GT Road commercial is more liquid than interior schemes.
GT Road N-5 commercial corridor analysis (120,000 daily vehicles), zoning comparison with MPCHS commercial plots, why GT Road commercial is more liquid than interior schemes.
GT Road N-5 commercial corridor analysis (120,000 daily vehicles), zoning comparison with MPCHS commercial plots, why GT Road commercial is more liquid than interior schemes.
GT Road N-5 commercial corridor analysis (120,000 daily vehicles), zoning comparison with MPCHS commercial plots, why GT Road commercial is more liquid than interior schemes.
GT Road N-5 commercial corridor analysis (120,000 daily vehicles), zoning comparison with MPCHS commercial plots, why GT Road commercial is more liquid than interior schemes.
GT Road N-5 commercial corridor analysis (120,000 daily vehicles), zoning comparison with MPCHS commercial plots, why GT Road commercial is more liquid than interior schemes.
GT Road N-5 commercial corridor analysis (120,000 daily vehicles), zoning comparison with MPCHS commercial plots, why GT Road commercial is more liquid than interior schemes.
GT Road N-5 commercial corridor analysis (120,000 daily vehicles), zoning comparison with MPCHS commercial plots, why GT Road commercial is more liquid than interior schemes.
GT Road N-5 commercial corridor analysis (120,000 daily vehicles), zoning comparison with MPCHS commercial plots, why GT Road commercial is more liquid than interior schemes.
GT Road N-5 commercial corridor analysis (120,000 daily vehicles), zoning comparison with MPCHS commercial plots, why GT Road commercial is more liquid than interior schemes.
GT Road N-5 commercial corridor analysis (120,000 daily vehicles), zoning comparison with MPCHS commercial plots, why GT Road commercial is more liquid than interior schemes.
GT Road N-5 commercial corridor analysis (120,000 daily vehicles), zoning comparison with MPCHS commercial plots, why GT Road commercial is more liquid than interior schemes.
GT Road N-5 commercial corridor analysis (120,000 daily vehicles), zoning comparison with MPCHS commercial plots, why GT Road commercial is more liquid than interior schemes.
GT Road N-5 commercial corridor analysis (120,000 daily vehicles), zoning comparison with MPCHS commercial plots, why GT Road commercial is more liquid than interior schemes.
Detailed Commercial Plots Categories & Options
Select a verified unit category below to view dedicated floor plans, pricing schedules, and statutory approval records.
Main Boulevard Commercial Plots
Detailed specifications, CAD layouts, NOC verification and live 2026 rates for Main Boulevard Commercial Plots in Mumtaz City.
Sector Commercial Plots
Detailed specifications, CAD layouts, NOC verification and live 2026 rates for Sector Commercial Plots in Mumtaz City.